
Air Quality Monitoring
April 2025
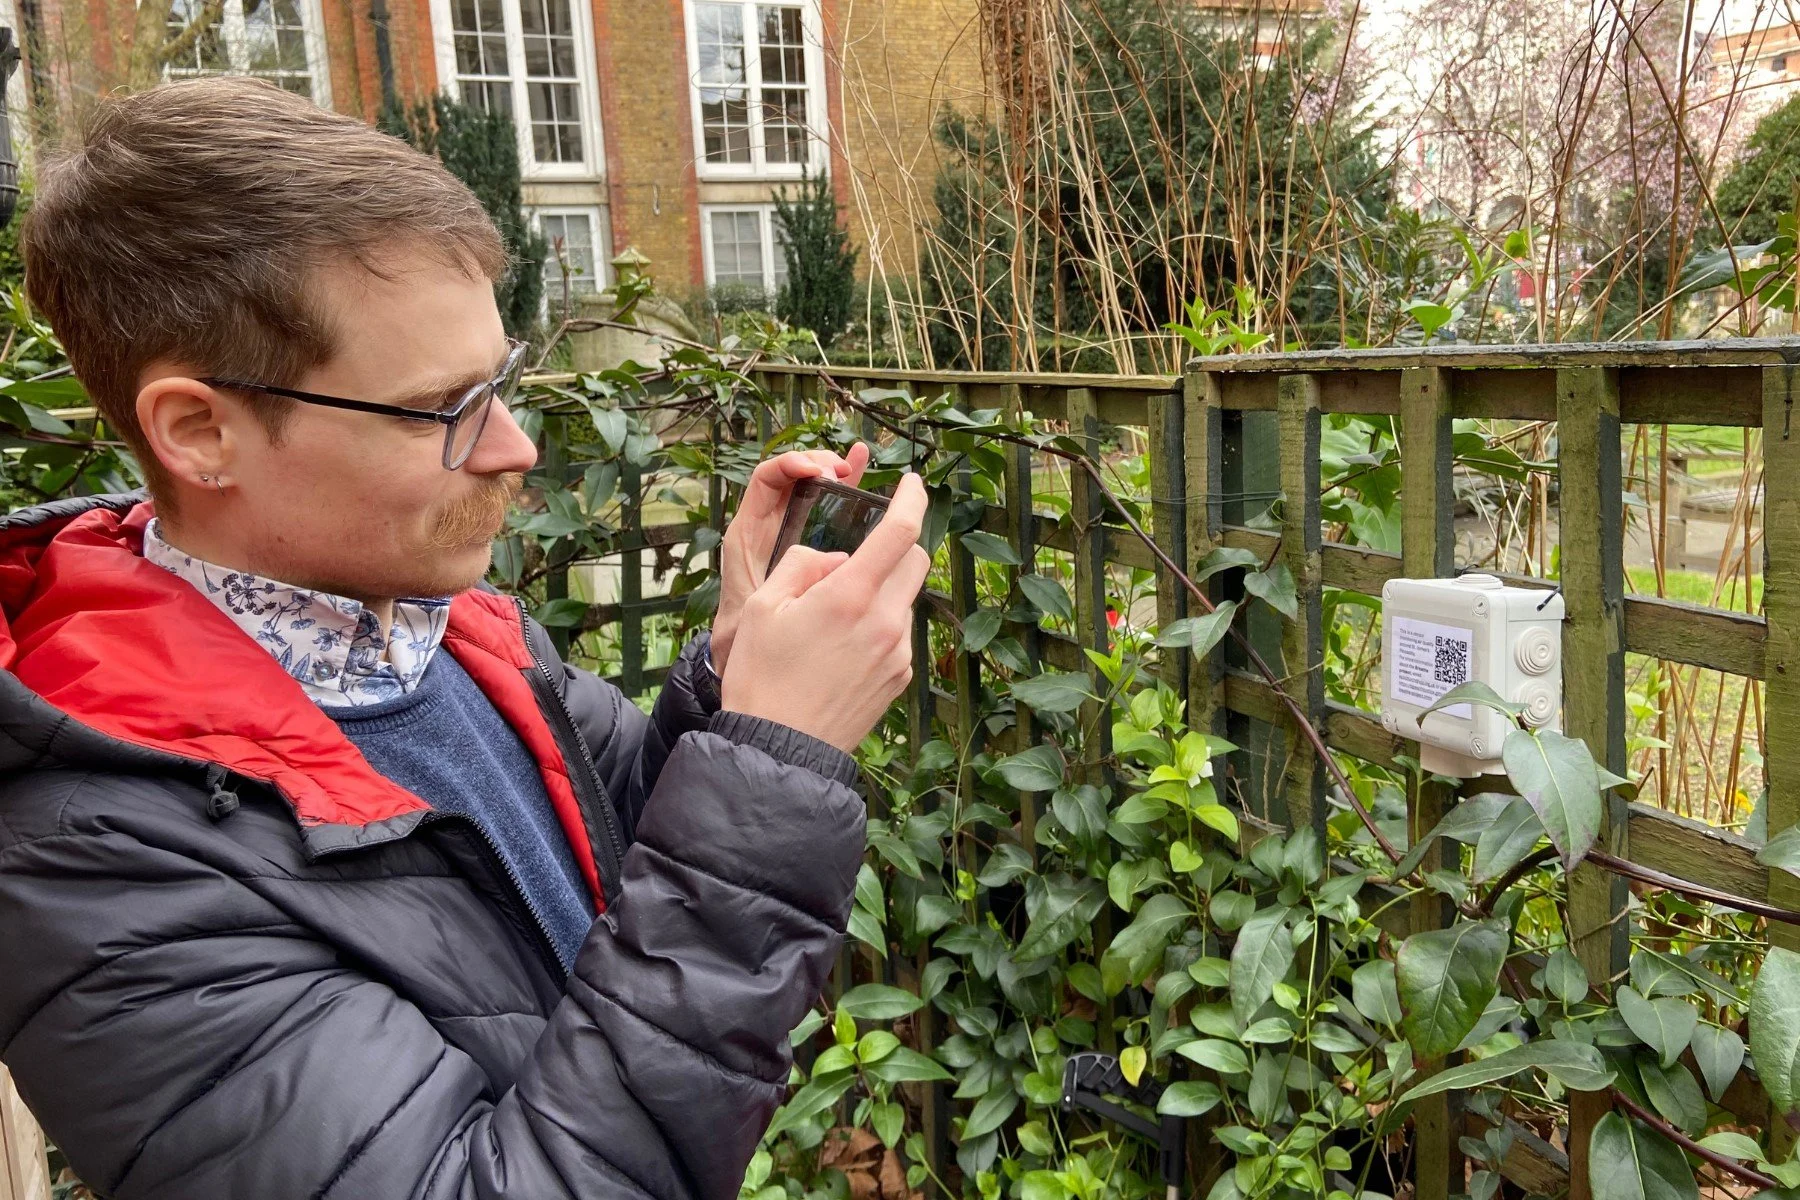
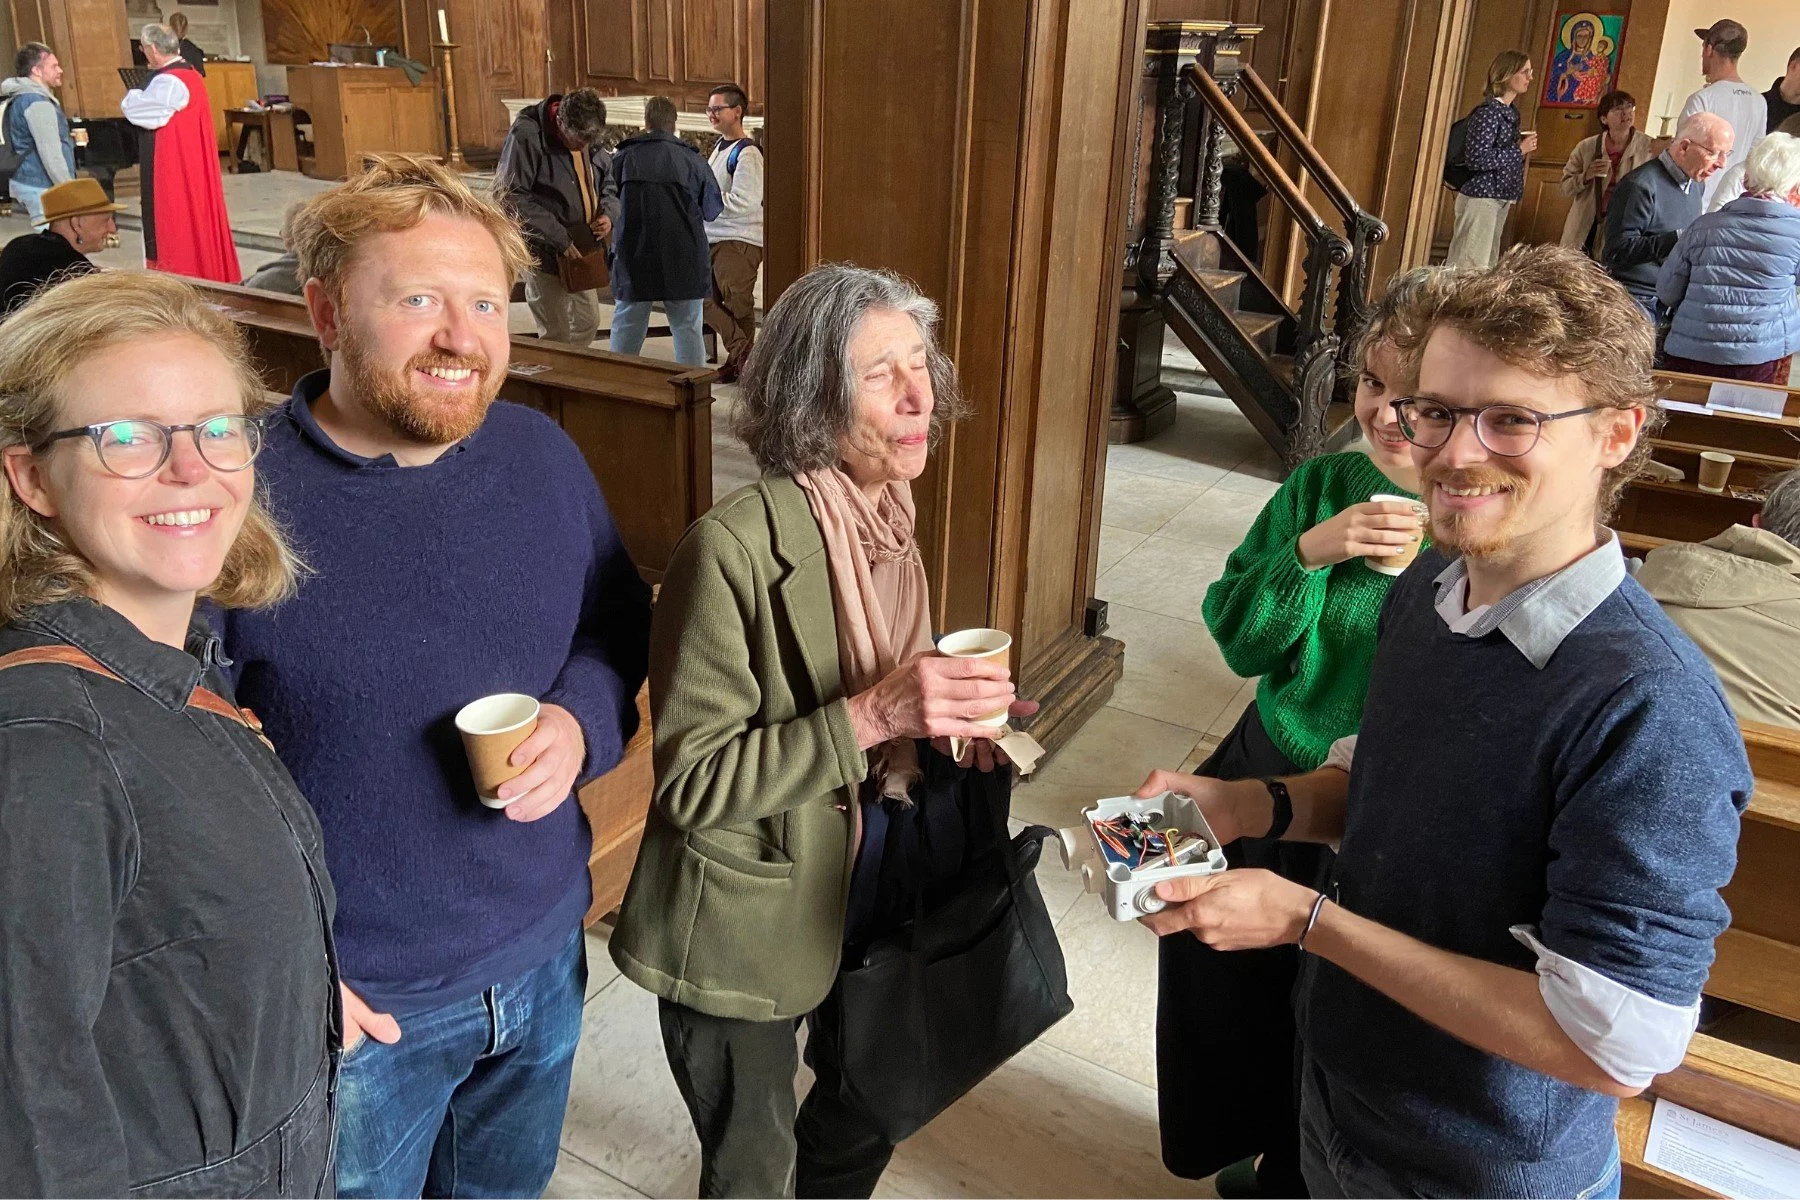
We have air quality monitoring sensors around St James’s Piccadilly built and monitored by Jonathan Sutton- Smutná.
In our initial pilot program in October last year, we deployed two homemade particulate matter loggers in the nave of St. James's Piccadilly. They are powered by rechargeable lithium-ion batteries, and collect readings of particulate matter levels for particles of different sizes (PM1, PM2.5, PM10) every 15 minutes. They also collect environmental data: including air temperature, humidity, and pressure.
Given the successful deployment and data collection from those loggers (and the surpisingly long battery life: one month!) we built three more loggers (a total of five) for deployment across the St. James's estate. Our goal is to understand how the air pollution levels vary in different places, and what that tells us about the church in which we worship.
Logger Locations
The initial two loggers were deployed side-by-side on the window ledge at the rearmost south window. This was in order to see how well their readings matched one another. For our redeployment in March they were separated, and now we have loggers in the:
Garden (Logger 1)
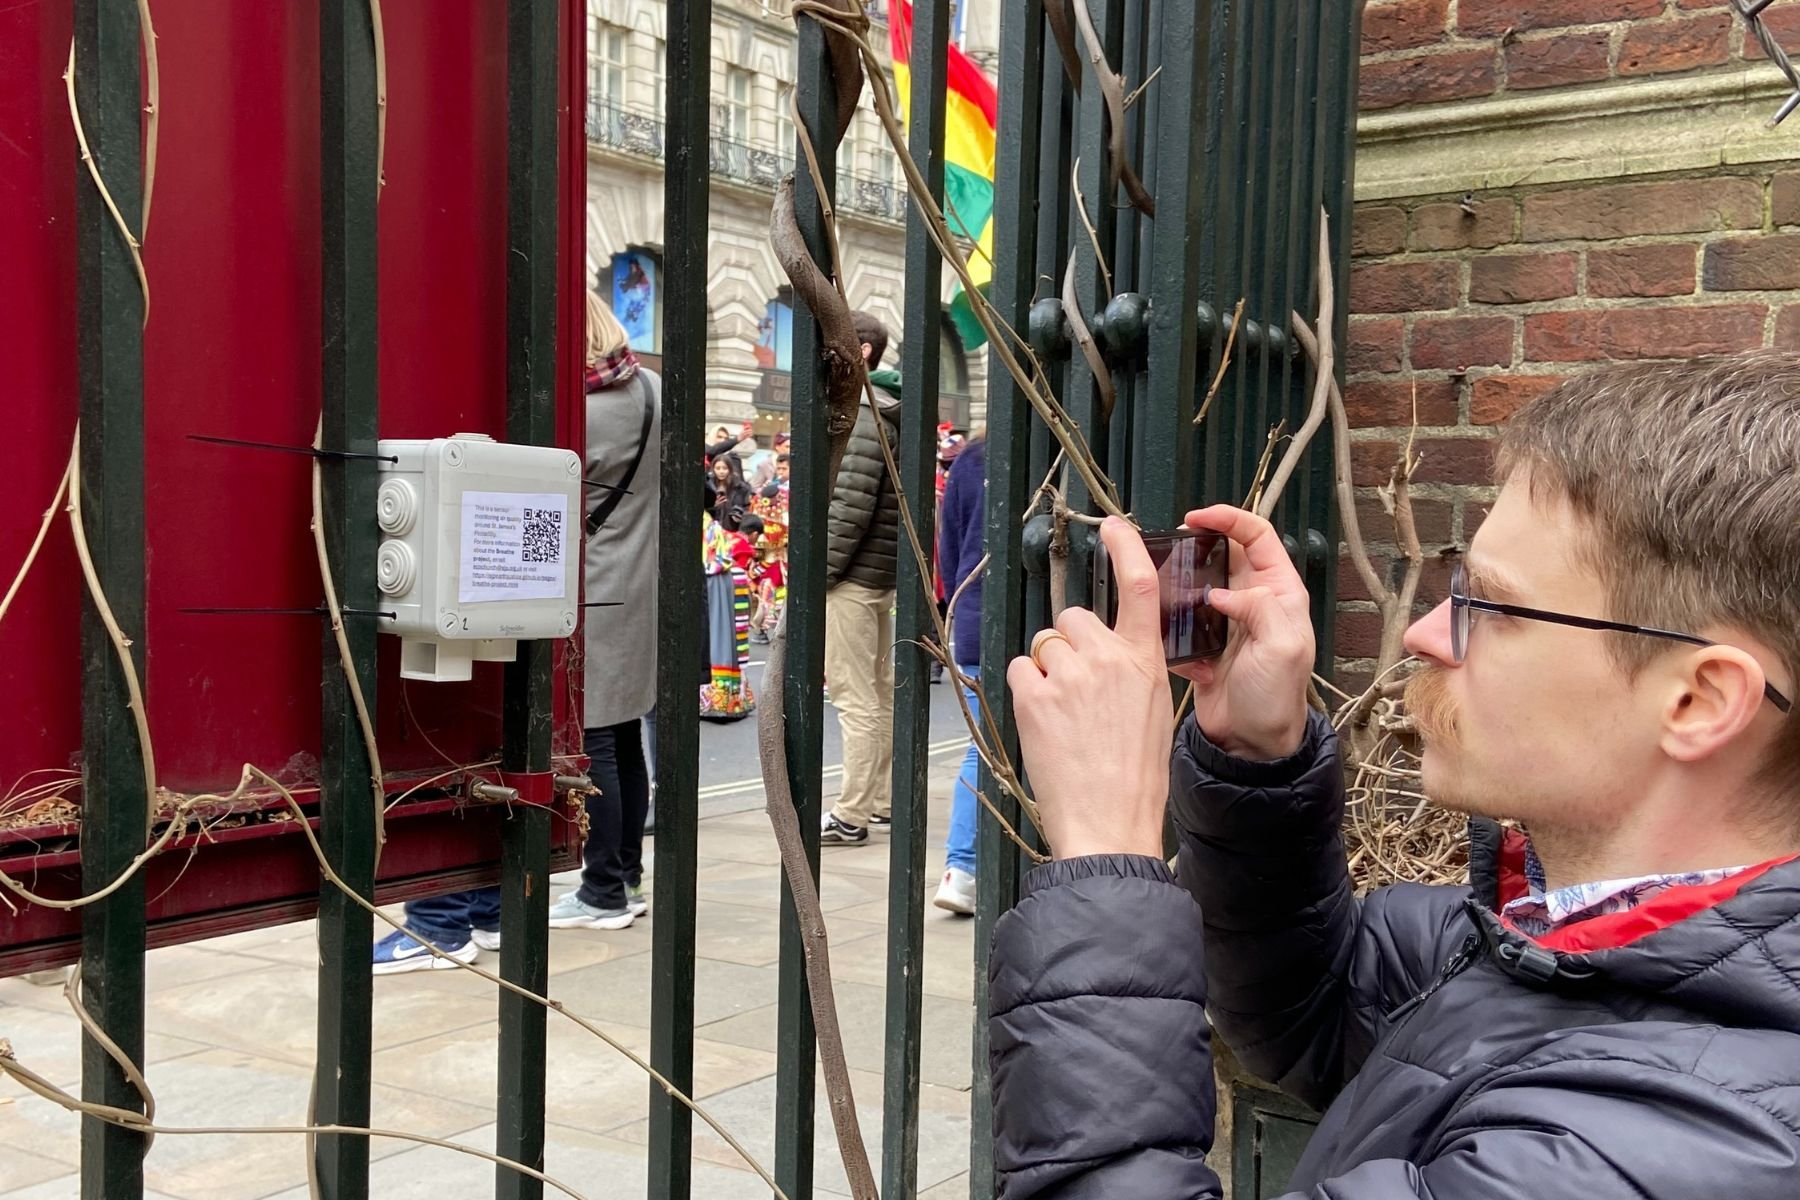
Churchyard (Logger 2)
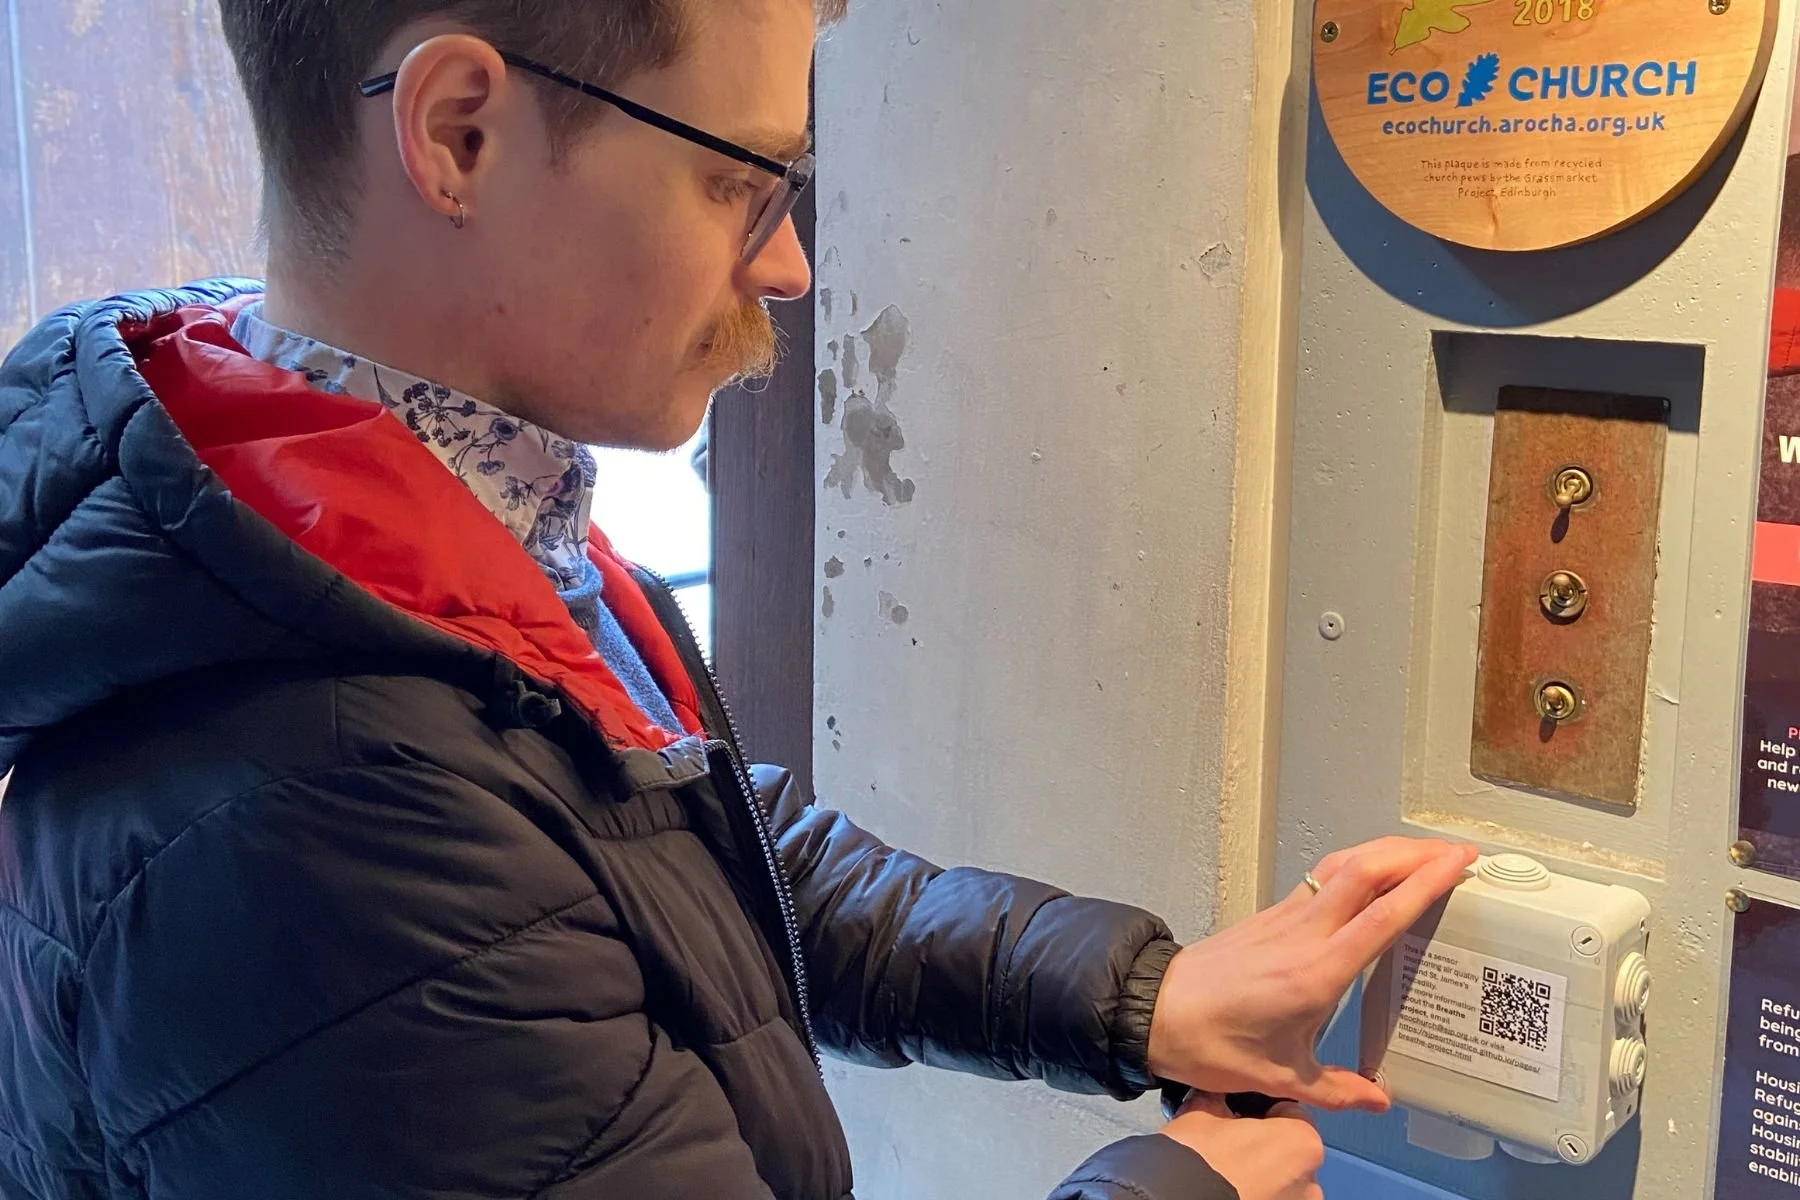
Narthex (Logger 3)
Nave (Logger 4)
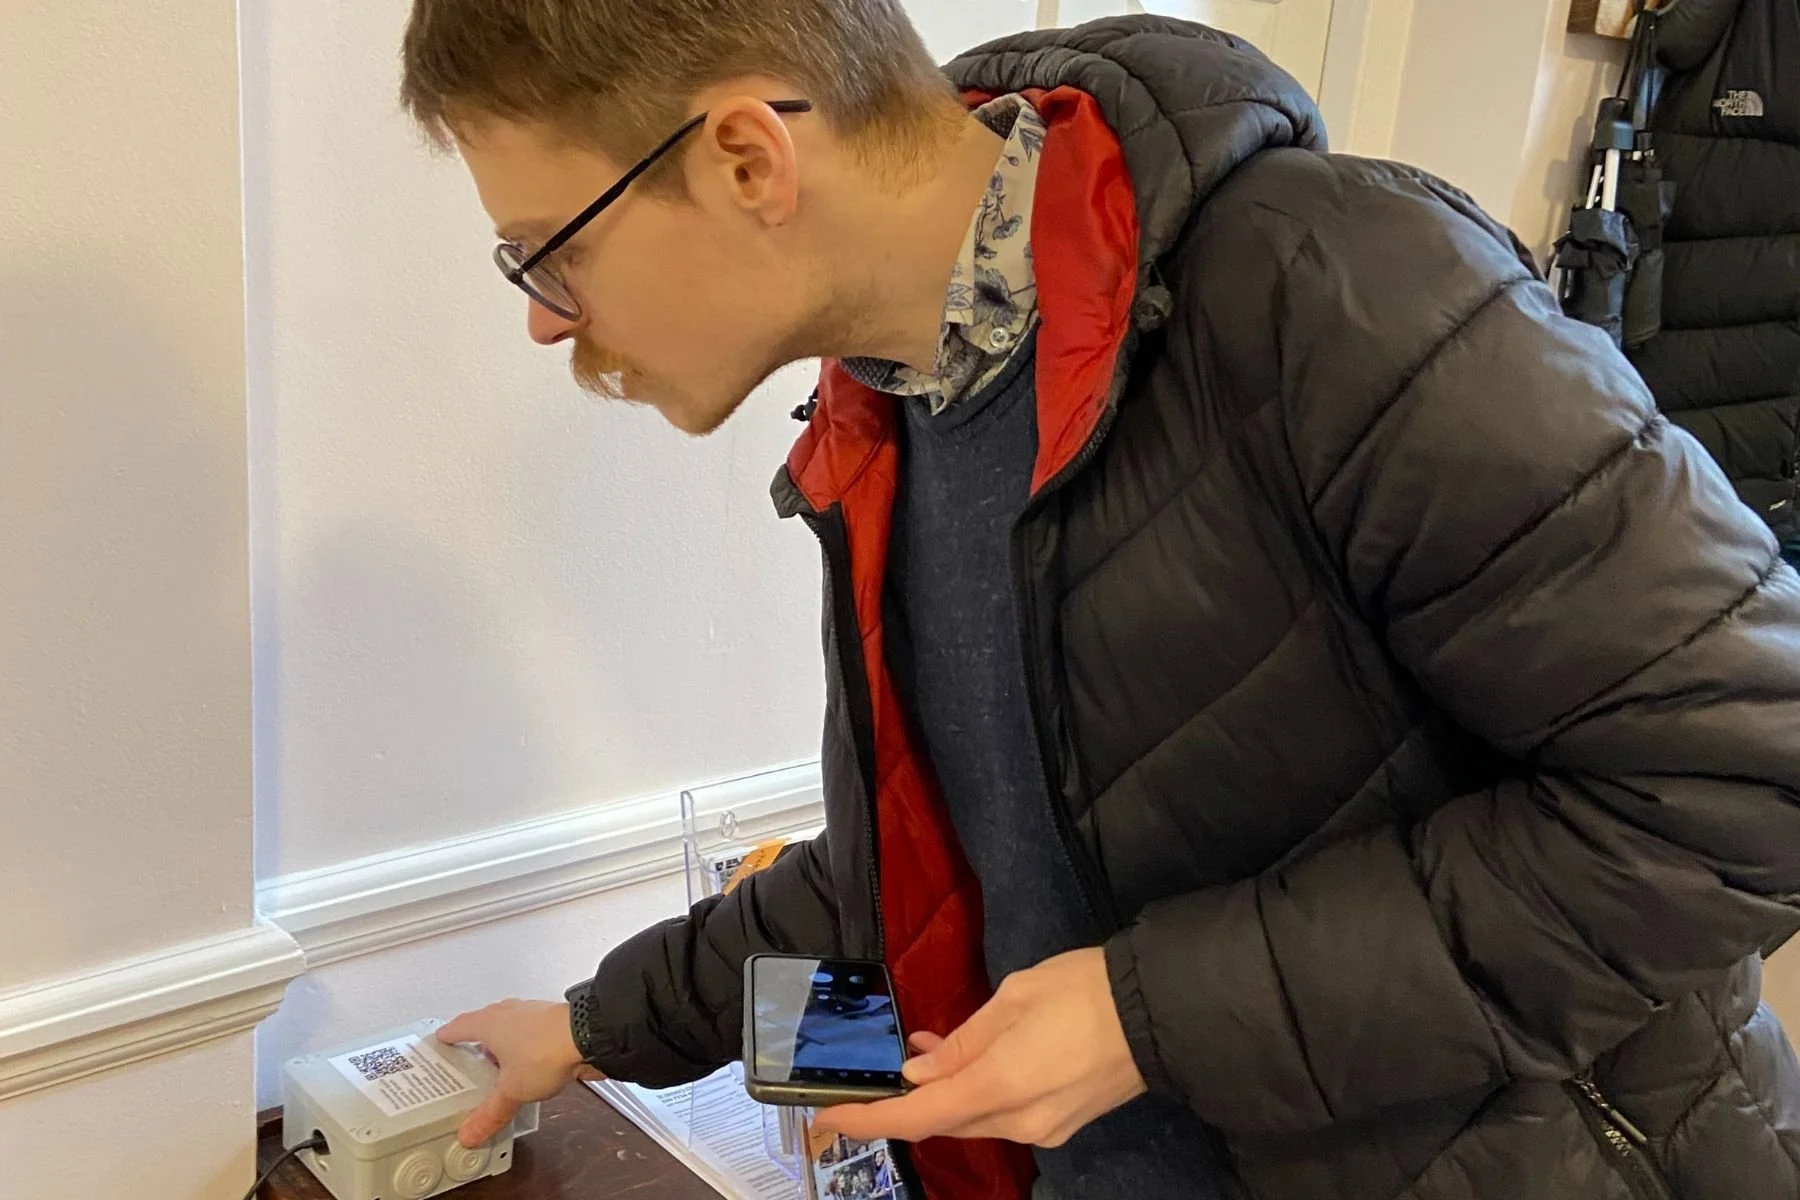
Rectory (Logger 5)
In order to inform members of the public and the congregation about the project, and to allow them to read more, we have also included information labels on the loggers with a QR code link to our project website.
We hope that this will enable us to compare the effects of different sources of air pollution, and also to see how those sources vary over time. For example, are the pollution levels from traffic worse in the churchyard or the garden? How do the measurements vary between weekdays in the nave?
Temperature data
Now that we have at least one month's worth of data from our five loggers, let's start by comparing the temperature measurements in the different locations. We can also get daily average temperatures from the MET Office station in Rothamsted (the closest one to St James’s Piccadilly).

There are some interesting things we can see from this:
Unsurprisingly, the MET Office data is consistently the coolest (London is usually a little warmer than its surroundings due to urban heat effects).
The measurements in the garden and churchyard follow the MET Office data the most closely: also unsurprising, given that they are outside!
Since both the church and the rectory are heated, they respond the least to outside temperature. The rectory is the least effected, likely due to better insulation and more consistent heating.
The measurements between the churchyard and the garden seem to differ consistently by ~1°C. The datasheet for the temperature sensor suggests that its measurements should be accurate within ±0.5°C, so this seems to be a real difference. This may be because of the difference between the many plants in the garden, and the hard surfaces in the churchyard.
The urban heat island effect means that areas with lots of hard impermeable surfaces tend to get hotter. This can often lead to urban heat inequity as a result of poorer urban areas having less green cover, which can help to mitigate the warming.
Particulate matter data
As a reminder, PM 2.5 is a measurement of particles that are smaller than 2.5 μm and likewise PM 10 is a measurement of particles smaller than 10 μm.

Hygroscopy
Something that we didn't do in the initial pilot was correct our particulate matter (PM) measurements for the air humidity. Tiny particles in the environment absorb water and swell up, and this happens more often when air humidity is higher. This is called hygroscopy. Because of this, the measurements we make of particles of different sizes might be incorrect when humidity is high. Also, depending on the substance that particles are made of, the amount of swelling will vary. This paper gives a method for correcting the measurements for common urban PM which we applied to our measurements

PM 10

As we found in the pilot, levels of particulate matter tend to spike inside the church each day, probably as a result of burning incense. The average levels outside the buildings (in the churchyard and the garden) mostly stay at or below the WHO guideline, with the prominent exception of the period 22nd-24th March. It turns out that this was probably because of a Saharan dust storm blowing over Europe at that time. Not something we need to worry about regularly!
PM 2.5

This is perhaps a little more worrying, although I am not confident that these results are correct. The WHO guideline for PM 2.5 is quite a bit lower than for PM 10, as a result of the potentially more severe health impacts of the smaller particles. When we look at our measurements for this, we see that even the loggers outside appear to regularly exceed the daily guidelines.
The London Air Quality monitoring network suggests that we should be (just) under the guideline value, although there is more pollution along Piccadilly, particularly at the junction with Sackville Street (just opposite SJP). The nearest monitoring station to SJP is at Waterloo Place, and this is reported as satisfying the WHO yearly target, but they don't have data for the daily values.
It will be interesting to see how this changes in comparison with the London Air Quality Network's data, and it may be worthwhile to reach out to them and ask about this discrepancy. It might be that we're missing something here!
Different sources of particulate matter
Because we have measurements of particles of different sizes at each of the locations, we can separate out these measurements to identify different sources of particulate matter. To do this, we identify measurements with high levels of particulates and then divide the measured particulates into small (< 1 μm), medium, and large (> 2.5 μm).
If we then plot the proportions of the large and small particles in each sample, we can see how the distribution differs between the logger locations.

Measurements with lots of larger particles are shown in the top left corner of the plot, measurements with lots of smaller particles are shown in the bottom right. From this, we can see that:
Almost all the measurements have lots more smaller particles than larger particles (they're under the dashed line).
The composition in the churchyard and in the garden are roughly the same (the points cluster together). Probably this composition is characteristic of urban pollution.
The composition in the nave is more towards the top left (i.e. there are generally more large particles). Probably this composition is more characteristic of incense and candles.
The composition in the rectory and the narthex is more towards the bottom right (i.e. there are generally more smaller particles). This is possibly because they have fewer larger (from the nave) or medium (from outside) particles. I expect that most of the particles in these locations is mostly from normal dust, but I'm not sure.
Next Steps
Now that we have all of the loggers deployed, we plan to continue collecting this data to improve our understanding of the church and its surroundings. The dataset can hopefully be used in future for other projects, campaigning, and perhaps for academic research. If you would like a copy of the data we've collected so far to look at yourself, please get in touch.

Explore more from Breathe Project
Collaborate With Us
We're always open to new ideas and creative partnerships that bring multiple perspectives into focus in the service of Earth Justice. Please get in touch.
Explore Our Projects
Explore our evolving archive of multi-disciplinary, collaborative projects. We value art, poetry, science, faith, history, community engagement and more, and the creative spaces that open up between them.