
Air Pollution Monitoring
October 2024
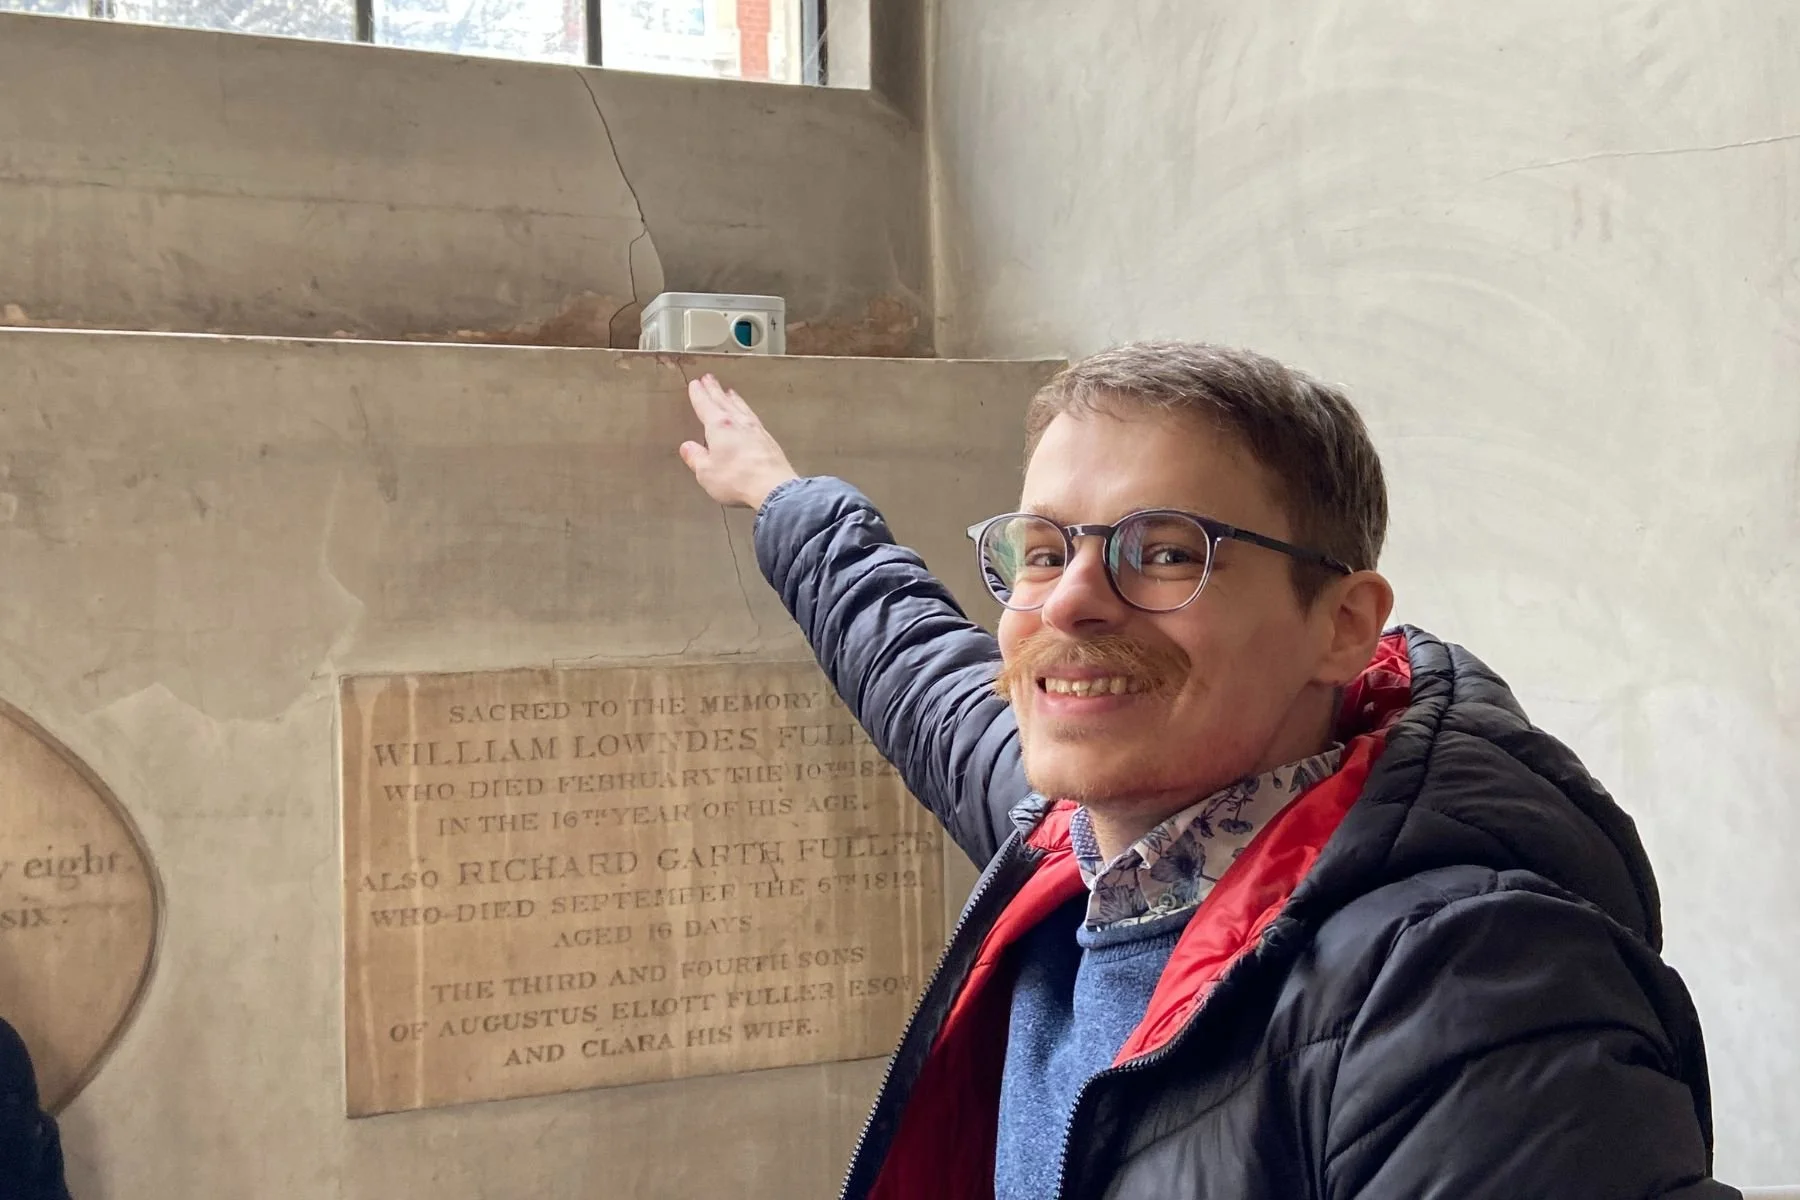
We have sensors around St James’s Piccadilly built and monitored by Jonathan Sutton - Smutná.
Air pollution is an increasing concern as the health effects are becoming more apparent. One important form of air pollution is "particulate matter (PM)" pollution, which is caused by microscopic particles of solids or liquids that are suspended in air. These can be natural (for example, salt droplets above the ocean), but most particulates of concern are caused by human activity. For example, a significant source of particulate matter pollution in the UK is domestic wood fires.
The two most common measurements of particulate air pollution are "fine particulate matter" (PM2.5) and "coarse particulate matter" (PM10). The number in the abbreviation refers to the size of the particles: PM10 refers to particles of diameter 10μm or less, and PM2.5 includes only particles smaller than 2.5μm.
As a result of increasing evidence of health impacts from particulate matter, the WHO has recently updated its air quality guidelines, which include particulate matter alongside other pollutants. The daily concentration limit they recommend is 15μg/m3 for PM2.5 and 45μg/m3 for PM10.
We have built two low-cost data loggers that have been deployed on the windowsill in the south west of the church nave for the last month. As a result, we have measurements of PM10, PM2.5, and PM1 every 15 minutes for the whole of October.
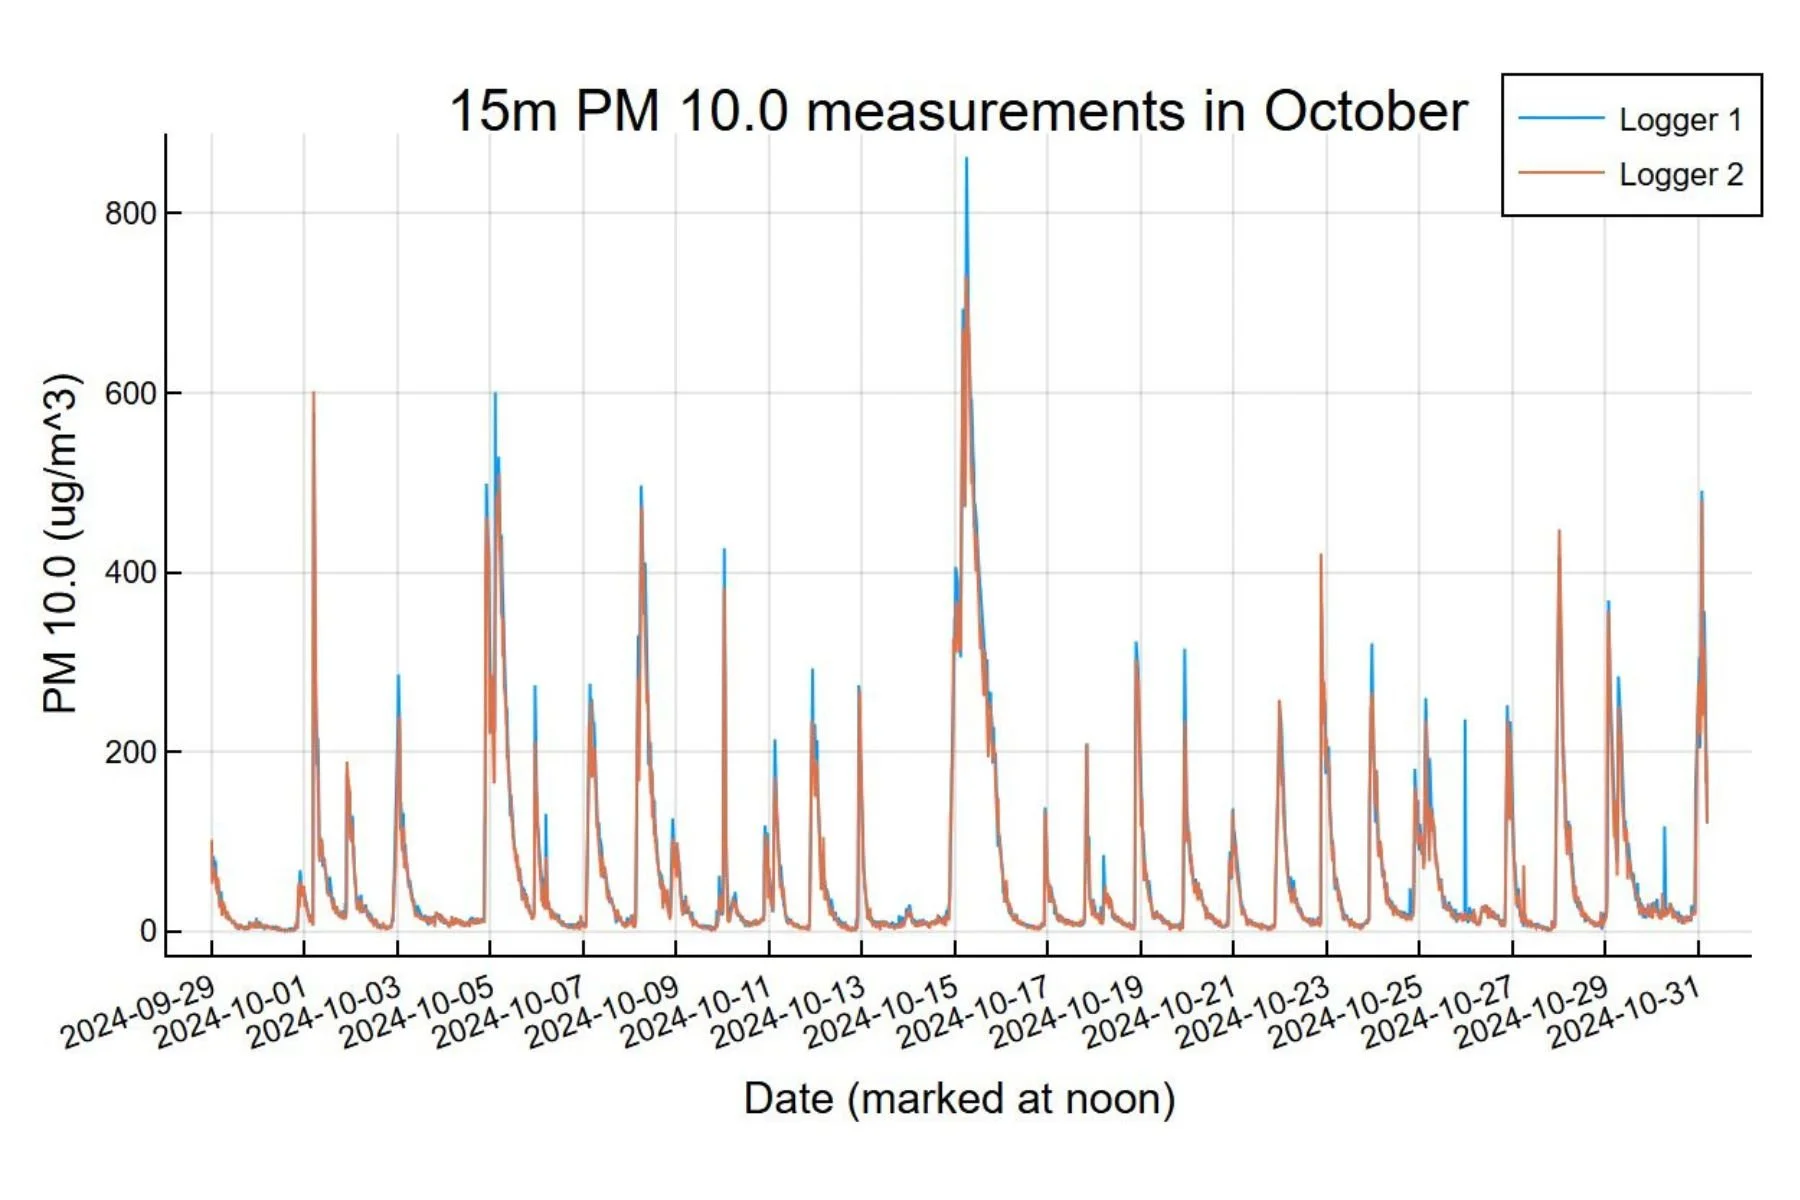
One of the first aims is to check that the two loggers agree with each other. We deployed them side-by-side to check that the sensors we are using are reliable. Here are the two time series for PM10 plotted alongside each other. It looks like we have a good amount of agreement!
But these measurements risk being misleadingly high. Instead, it's better to take a 24-hour moving average, so that we get an impression of the level of particulates over the course of a day. We can then compare this with the WHO guidelines.

So it seems that the particulate matter measurements we get for PM10 regularly exceed the WHO's recommended daily exposure level. This might be alarming, but it's important to remember several things:
These sensors are reliable, but they are not research grade.
The sensors are currently positioned on a dusty shelf near a storage area, which may mean that they are exposed to higher levels of particulates than the nave as a whole.
Even if PM levels are high, most people won't be in the church for longer than an hour or two, which means that WHO's daily guidelines might not apply (I am not an expert).
Identifying Sources
Apart from measuring the levels of particulates in the nave, we can also try and identify different sources of particulates. Because we have measurements for PM1, PM2.5 and PM10, we can try to identify different sources of particulates by the relative amount of large and small particles that are present.
Let's try taking high particulate measurements and plotting them by the proportion of large or small particles. We can colour them by weekday and see if any patterns emerge.

It's hard to see the differences here, because the weekdays are quite similar to each other. However, it does look like the particulates on Tuesdays and Saturdays tend to be a bit bigger, and those on Wednesdays tend to be a bit smaller.
It might be more useful to look at specific known events. Instead of looking at all weekdays, let's instead only look at data from Sanctuary (5:30-8pm Tuesdays) and Sunday Eucharist (10:30am-1pm Sunday).
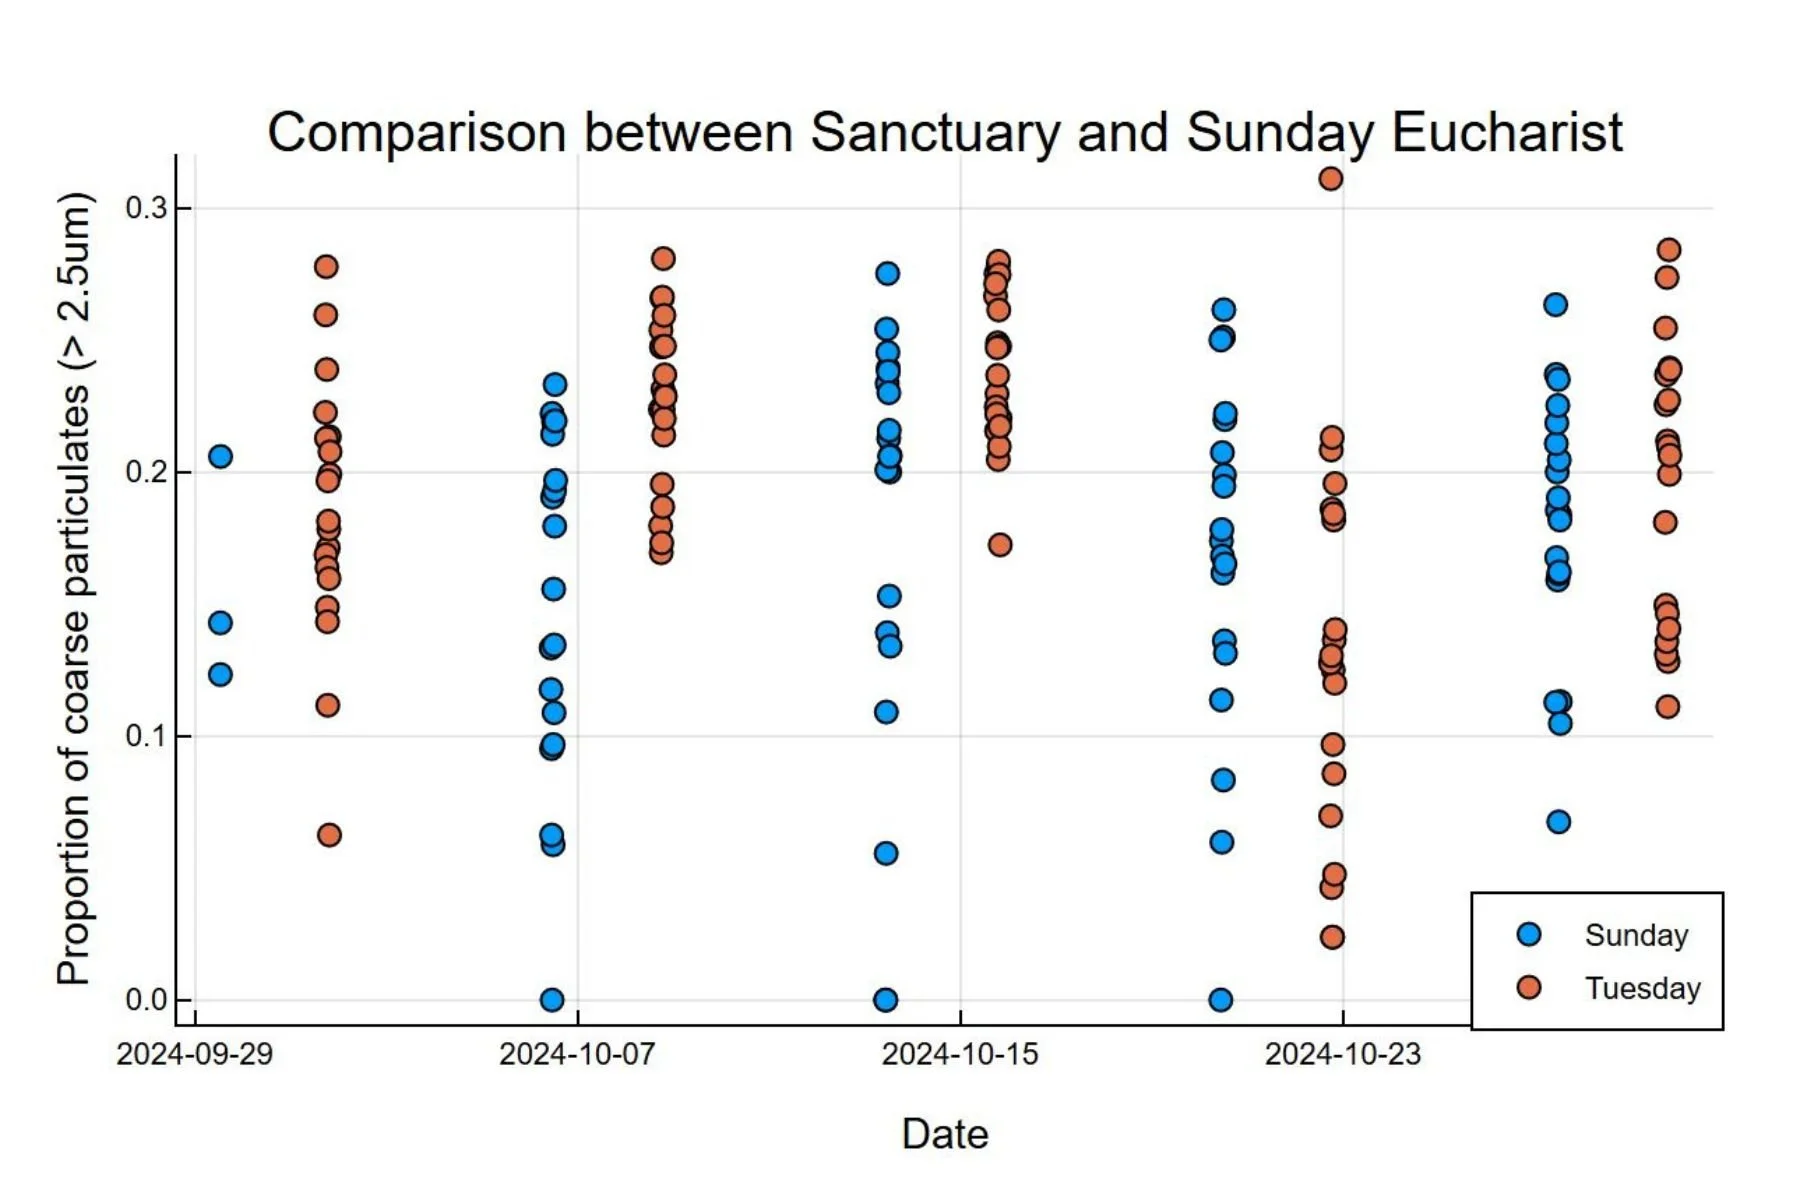
It does look like there is a really difference here: the Sunday Eucharist seems to have a slight bias away from coarse particulates compared to the Tuesday Sanctuary. This means that more particulates on the Sunday are in the smaller category (<2.5μm). We can check this by doing a Welch's t-test:
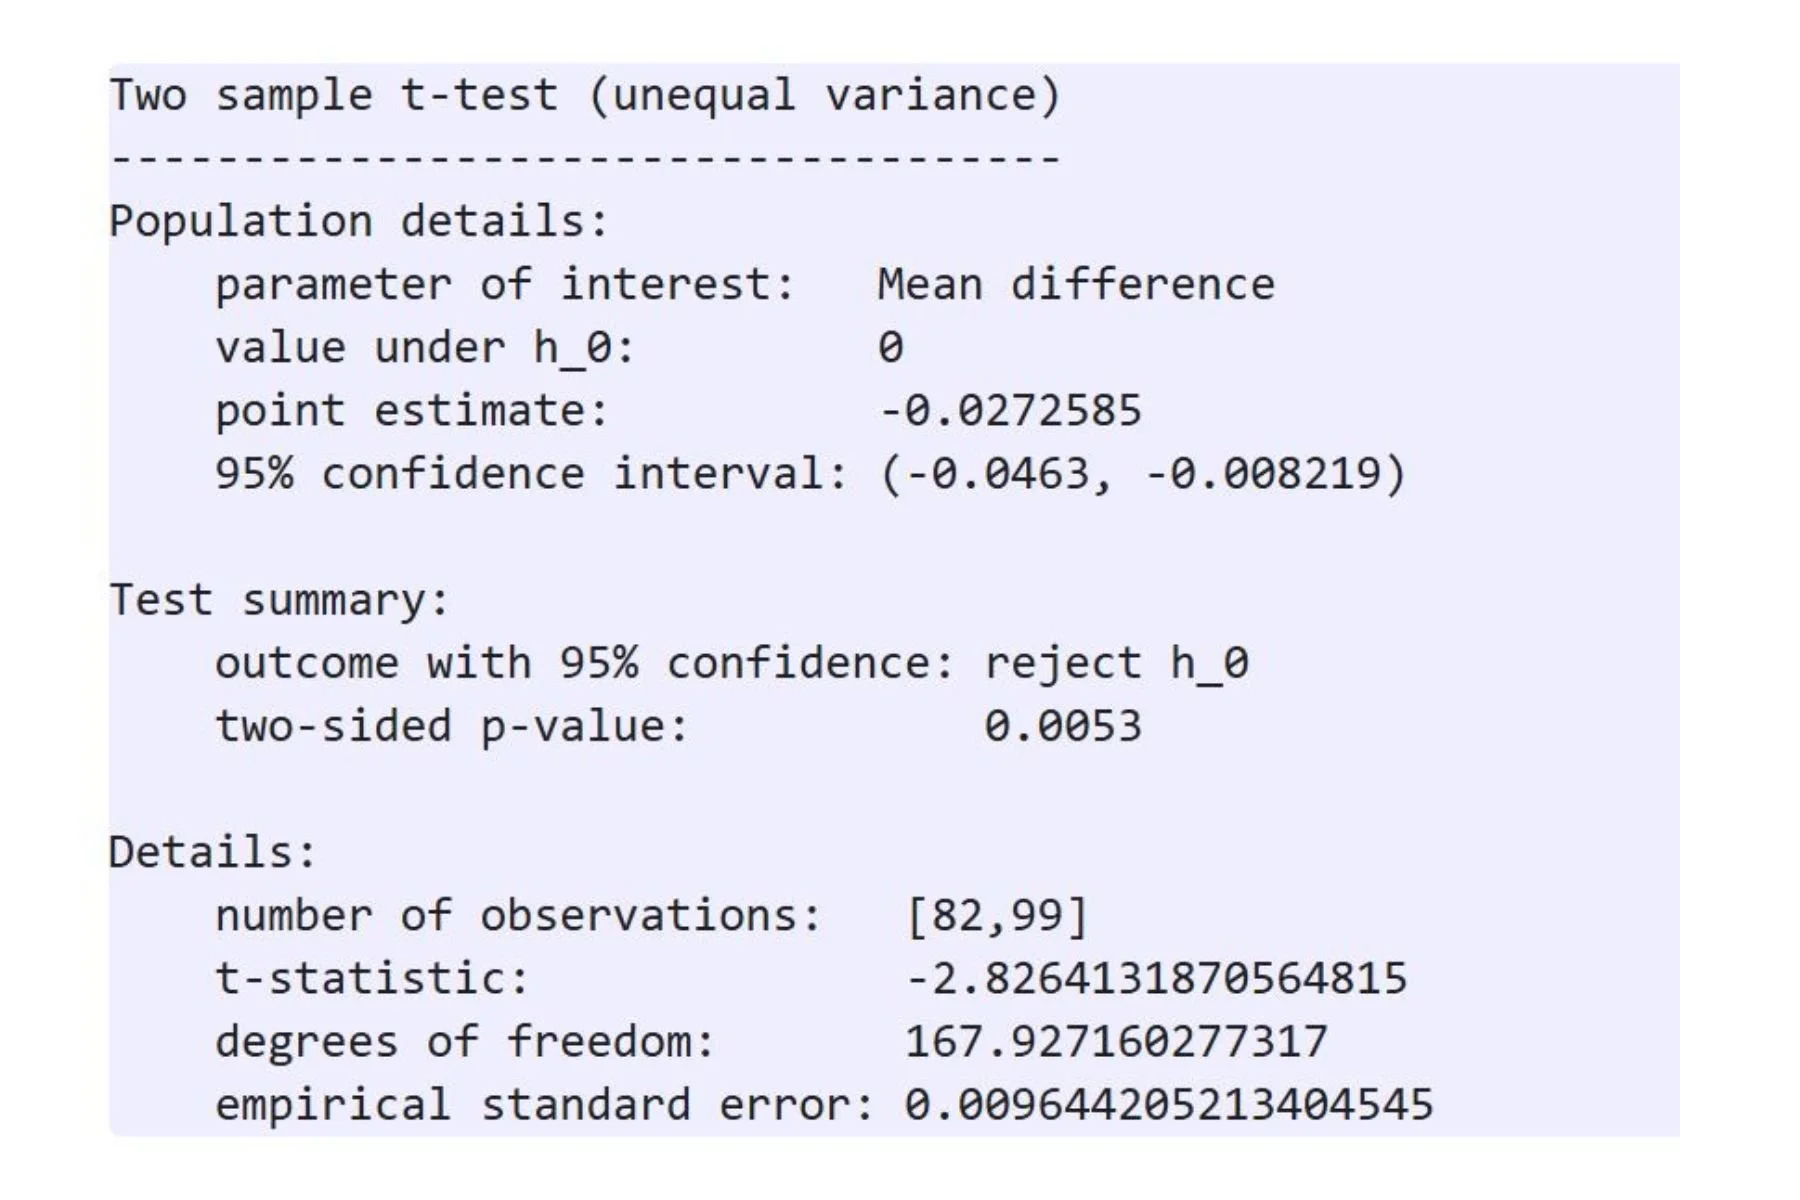
and indeed, this difference is statistically significant.
Environmental Data
As well as particulate matter sensors, the loggers we have deployed also have sensors for temperature, pressure, and humidity. This pontentially allows us to look at the impacts of climate change once we have sensors outside. For now, let's compare our measurements with the MET Office's daily temperature means for across England (this is the only data I could find quickly).
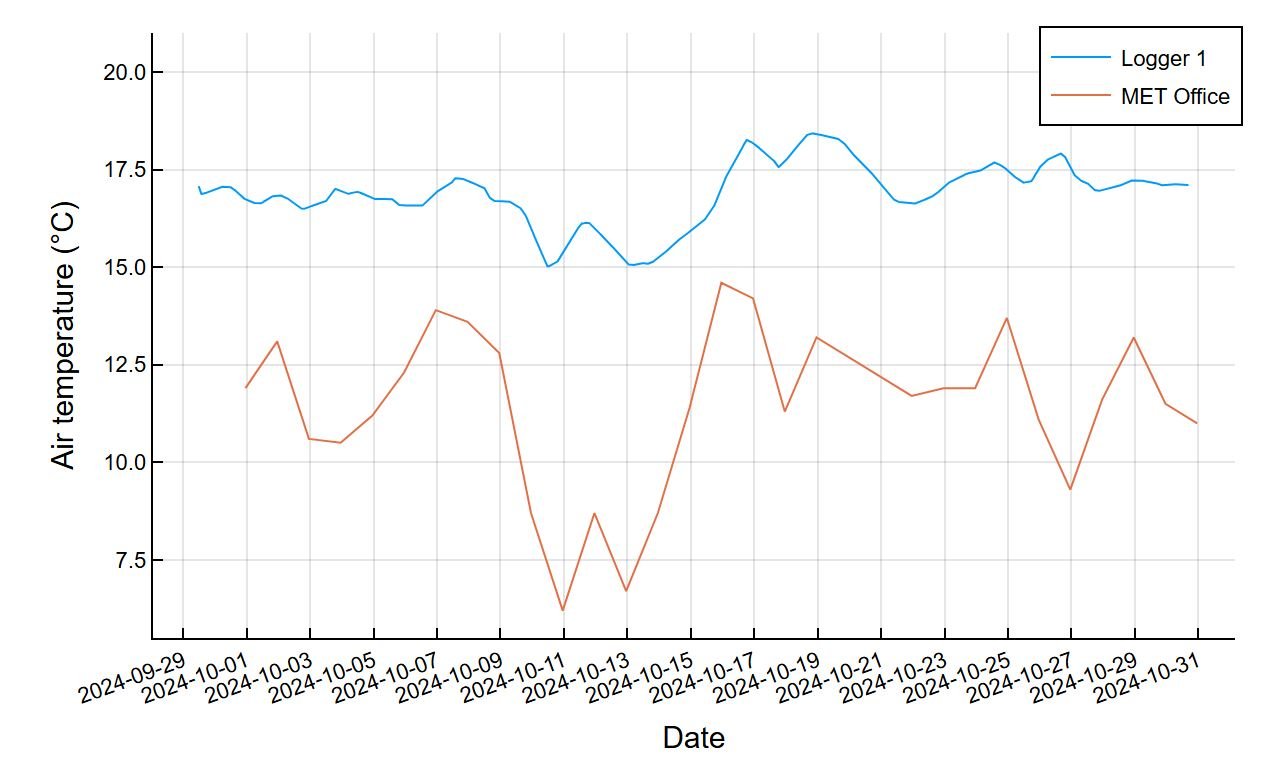
These trends broadly mirror each other (including the cold snap between 11th-13th), but of course with added insulation and heating the nave is much warmer than outside -- and London tends to be a little warmer than the national average too.

Explore more from Breathe Project
Collaborate With Us
We're always open to new ideas and creative partnerships that bring multiple perspectives into focus in the service of Earth Justice. Please get in touch.
Explore Our Projects
Explore our evolving archive of multi-disciplinary, collaborative projects. We value art, poetry, science, faith, history, community engagement and more, and the creative spaces that open up between them.
Collaborate with us
We're always open to new collaborations and creative partnerships that blend art, science and faith and community involvement to think differently about Earth Justice.
Explore All Our Projects
Nulla id congue ligula, pharetra venenatis massa. Aliquam in tellus varius, lacinia lorem ac, venenatis nunc. Donec neque nulla, convallis vel justo vitae, convallis imperdiet diam. Aliquam erat volutpat.